
From time to time I am asked by my customers and prospects who are wondered if there is any way with in Oracle HCM Cloud to represent hierarchical organizational structures in graphical views. I knew that Oracle BIEE can use Google Charts APIs to render Organization Charts and I tried to sort out the details to get the most of that technique. I also was going to figure out how to place some formatting and interactive features. let’s see what I managed to get.
Google Charts library can be utilized within Fusion HCM OTBI for visual representation of Management Hierarchies as well as Department – Position – Employee relationships.
So how does the API work? That is a JavaScript library so the basic knowledge of JavaScript will be helpful. Basically we include the API on our narrative view and then make calls to the various methods provided. The developer page has a simple example that we can use as our starting point. Please take a quick look over there before continuing reading. https://developers.google.com/chart/interactive/docs/gallery/orgchart
Let me briefly introduce the steps to build Organization Charts in OTBI Analyses.
So I am going to build a Management Organizational Chart with a prompt for a top manager. Also I would like to link a report to nodes to be able to drill into linked report for every employee in the hierarchy. A linked report will show current performance goals for a given employee.
- I created a BI Analysis based on the Workforce Management – Worker Assignment Real Time subject area. I took only the five first levels of management hierarchy.

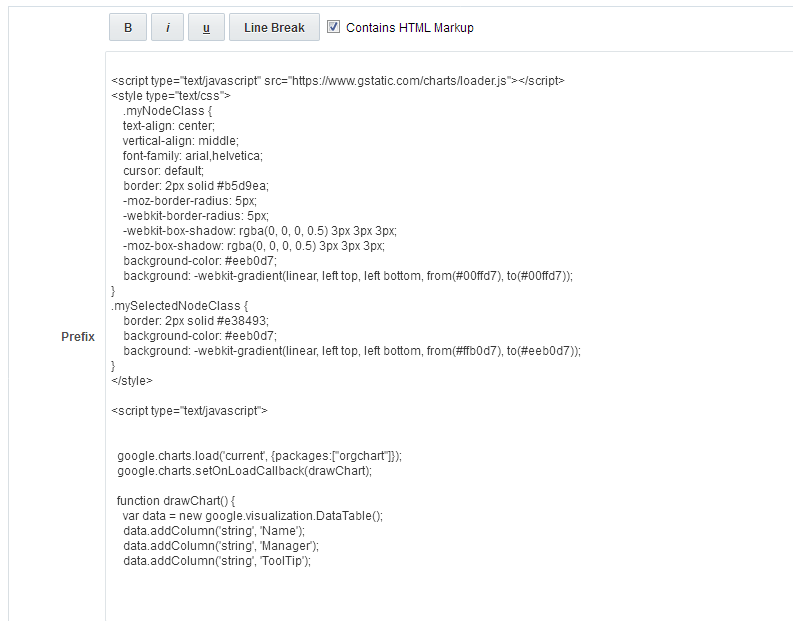
- In the second step we should incorporate a JavaScript code into a narrative view of our analysis. The one important thing we should do is to transform analysis columns into child – parent relationship. The first column presents a unique child node and the second column presents a parent node. We use @1, …, @6 variables to address analysis columns. I was surprised when I found out that a chart was rendered even in Narrative View (Make sure you checked “Contains HTML Markup checkbox).
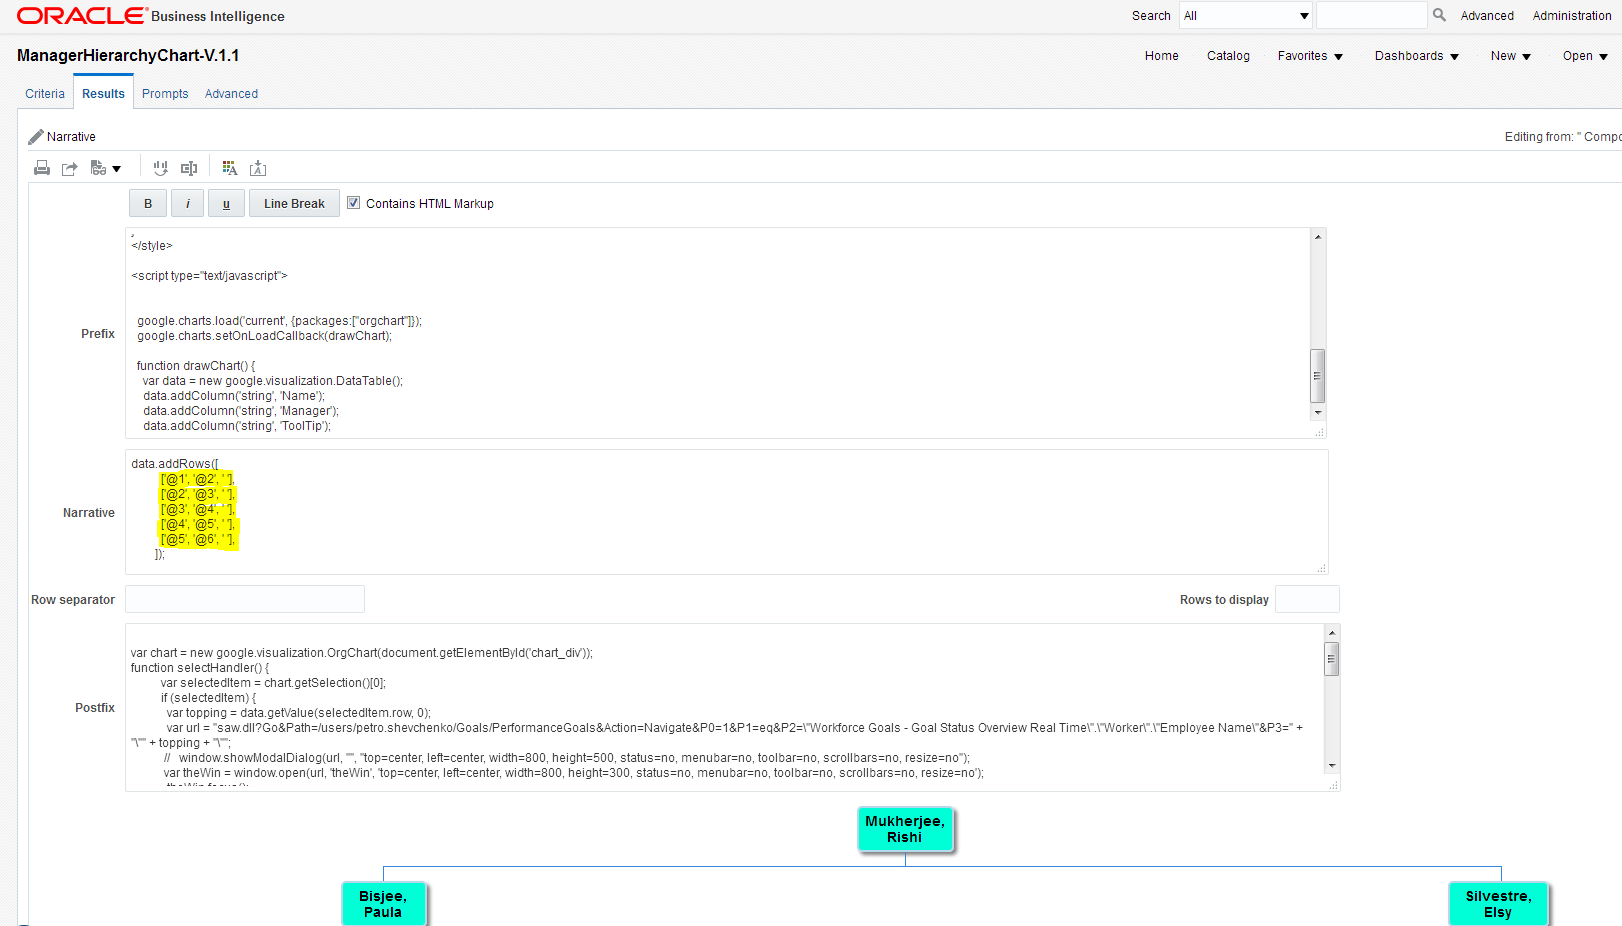
Here are the Prefix and Postfix sections:
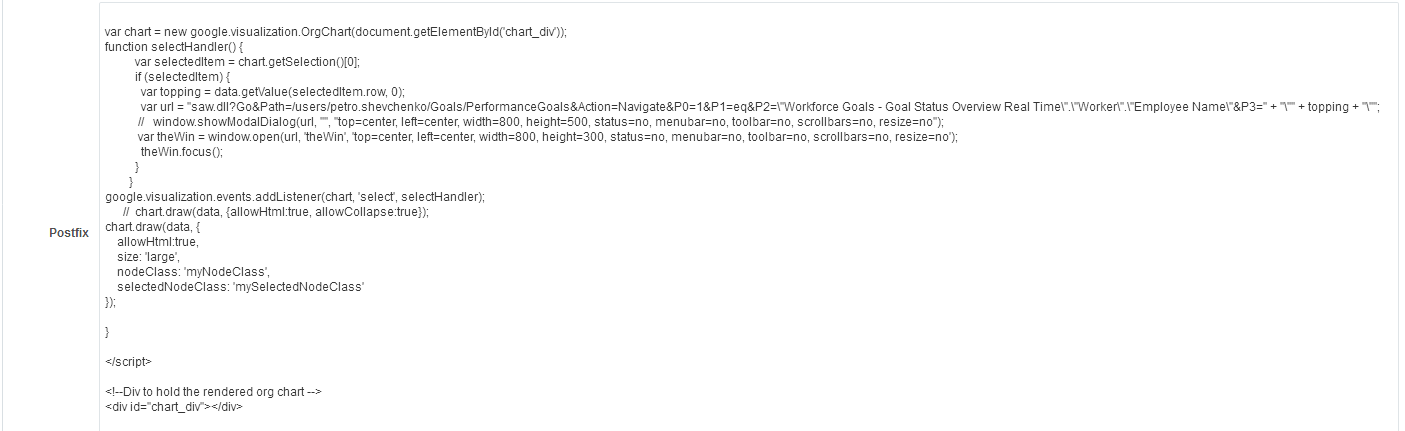
- Within a JavaScript code I managed to link another BI Analysis using the GO URL approach. Please see an explanation here: https://gerardnico.com/wiki/dat/obiee/obips/url_filter
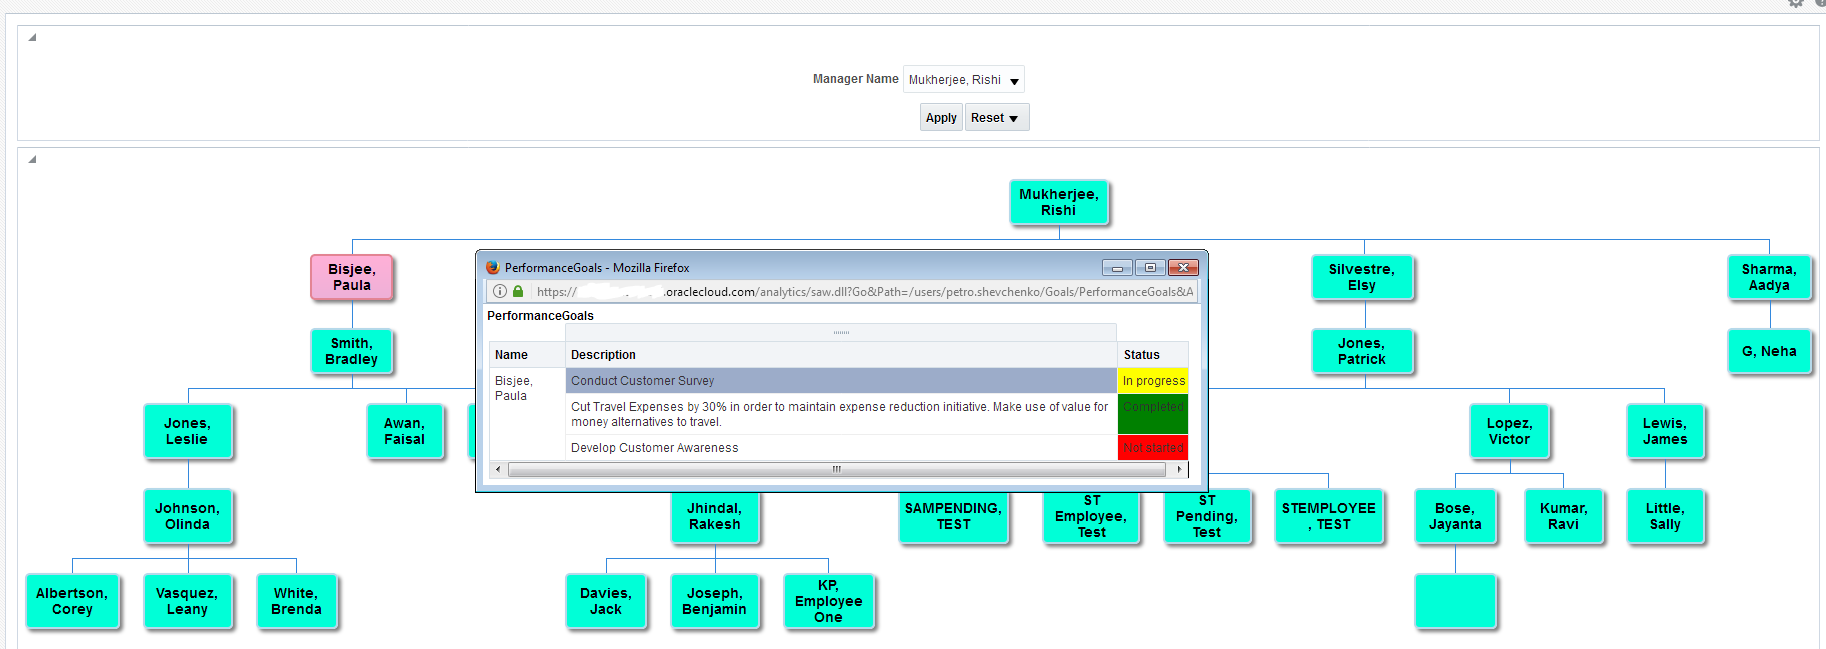
- Finally I created a dashboard and a dashboard prompt.
You can see how it looks like on the animated video below:
That report was built in the TEST demo environment and there might be some inconsistencies I apologize for.
I hope it will be helpful.
Good luck and remember:
“You miss 100% of the shots you don’t take.” ~ Wayne Gretzky
Best Regards,
Volodymyr
2 responses on "Hierarchy Visualization in OTBI using Google Organization Charts"
Leave a Message
You must be logged in to post a comment.
Recent Posts
Migrate Payroll Calculation cards to the latest in release 13
October 09,2018 / Fusion HCM Fusion Payroll / 0 CommentsIn this article, we will demonstrate how to Migrate Payroll Calculation Cards to the latest in...
Access dashboard report from springboard page in Fusion Applications
October 07,2018 / Uncategorized / 0 CommentsIntroduction In this article we will demonstrate how to access dashboard report from springboard...

How to enable Application Help in Fusion R13
August 13,2018 / Fusion HCM / 0 CommentsAs we all know by now, Oracle Fusion is going through a series of changes with every release and...


Can you please post the archived file for this report if possible?
This is really neat, and I’ve got this working in our environment and see value in moving forward, but I cannot figure out how to suppress that ‘final’ null value box that appears in the hierarchy each time. I have tried selection steps and criteria filters with no luck. The java is reading the null value as a space ‘ ‘ it appears.